


ON THIS PAGE
Information
System Architecture
ATMS Map is a geographically accurate display of Los Angeles County roadways with overlying layers of dynamic icons to represent various types of devices, congestion links, and incidents within the IEN.
Operators can pan and zoom the map to quickly navigate throughout the roadway network and activate or deactivate the individual layers according to their needs. Operators can interact with the icons to see more detailed information, to update the location or status of an incident, and to issue commands to devices in the field.
The IEN map layers include:
- Intersection Layer: Contains icons that represent intersection controllers at their geographic positions. Intersection icons can display various types of operational and timing status and provide command options for authorized users.
- Arterial Congestion Link Layer: Displays aggregate volume, occupancy, V+kO, and speed measurements from detectors along arterial segments.
- Freeway Link Layer: Displays aggregate volume, occupancy, and speed measurements from detectors on County freeways.
- Incidents Layer: Shows the location of incidents throughout the County, allowing users to monitor and manage the affect on traffic flow.
- Planned Event: Shows the location of pre-planned events that affect traffic flow and can include alternate route notations and other mitigating information.
- Informational Layer: Displays user-created textual and graphical annotations on the map.
Additional layers can be added as the IEN expands to support new types of devices.
ATMS Explorer
ATMS Explorer is a powerful diagramming platform on which users can create customized graphics to visualize detailed system status and performance information.
An ATMS Explorer document consists of a set of icons drawn on top of a static background. These “icons” can be controls or other types of embeddable objects, such as CorelDraw drawings or Excel spreadsheets. ATMS Explorer includes special support for the following:
- Custom ATMS controls (such as intersection controller icons, green arrow icons, pedestrian icons, and many more)
- Linking diagrams together to allow users to navigate from intersection to intersection even across jurisdictional boundaries
- Integration with other IEN applications
Incident Tracking and Management System
The TransSuite Incident Tracking and Management System, or IMS, enables users to view, respond to, and track the incidents and planned events that occur within their roadway network. IMS is a particularly powerful tool when used in multi-jurisdictional systems such as the IEN, allowing multiple agencies to collaborate and coordinate their response efforts.
IMS automatically plots the geographical location of an event and accepts internal and external input. Operators can quickly navigate between event details in IMS and the event location in an ATMS Map display.
Operators can view and maintain detailed information for each incident and event such as the following:
- Operator communications
- Communications between agencies
- Arrivals and departures of on-site responders (e.g., police, fire, ambulance, etc.)
IMS maintains customizable contact information for participating agencies and officials. It also logs all actions and changes for each incident. Printed database reports are available to show various types of event metrics over user-selectable time periods.
IMS supports integrated scenario management. Authorized operators can activate pre-defined scenario plans in response to an event and link the plans to the events so they can be managed together.
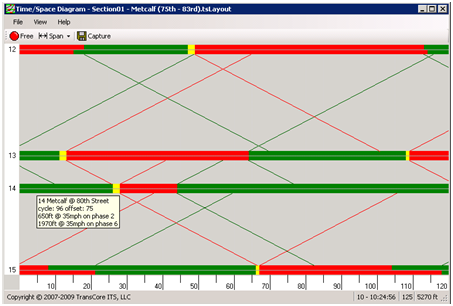
Time/Space Diagram
The TransSuite Time/Space Diagram application graphs the timing coordination data of a set of intersections along a roadway to simulate how well traffic is progressing from one intersection to the next. This data can be graphed in real-time as it streams in from traffic control systems or it can be captured and replayed at a later time. The Time/Space Diagram can also show how offset changes would affect traffic flow.
IEN Alarm Viewer
The IEN Alarm Viewer displays traffic control system, coordination, and operator alarms. The IEN monitors incoming intersection status data and generates a traffic control system alarm whenever a door open, flash, conflict flash, or internal error condition is reported. The IEN can be configured to monitor intersection coordination parameters (communication state, control mode, timing plan, cycle length, and offset) and to generate alarms when an intersection is operating with different coordination parameters that it did at the same time the previous week. Operator alarms are manually generated by users.
Traffic control system and coordination alarms are only made visible to operators that hold the view privilege for the generating device. Operator alarms are visible to all other operators. Authorized operators can acknowledge an alarm to indicate that action is being taken to investigate and correct the problem. Alarms are cleared when the alarm condition ends (automatically) or at operator direction (manually).
IEN Scenario Manager
The IEN Scenario Manager enables operators to monitor and manage scenario plans. A scenario plan is a pre-planned set of device commands that are executed together. For example, a “Stadium Exit” scenario plan could include a set of commands that prioritize traffic flowing away from the stadium at the end of an event. IEN scenario plans may include devices from different jurisdictions.
Operators are able to search the database for a plan that meets their needs and then activate the plan if they are authorized to do so. The Scenario Manager reports the status of the each action within a plan. Scenario plans will either timeout when their duration expires or they can be deactivated manually.